


Where do you really think Kentucky’s public education system ranks?
Over the past several months, Kentuckians have been bombarded with claims about how the state’s education system rose from the bottom of the stack to supposedly now rank around the middle of all the states.
For example, a spokesperson from the University of Kentucky’s Collaborative Center for Literacy Development asserted that the state now ranks in the middle for reading during a recent Kentucky Interim Joint Education Committee meeting.
Then a recent article in a Northern Kentucky online news service claimed the state ranked 19th.
And, the same sort of claim showed up yet again in a recent op-ed from a student at the Gatton Academy for Mathematics and Science, this time pegging the state in 29th place. This student also claimed Kentucky had made great progress.

Richard Innes
But, are these assertions accurate? Is Kentucky’s education system now in the middle of the pack?
To answer that question, I put together a short paper for the Bluegrass Institute, While Kentucky’s Education System Was Sleeping…,” to see what the scores show when analyzed the way the National Assessment of Educational Progress’ (NAEP) own documentation, such as a special section on Page 32 in the 2009 NAEP Science Report Card, recommends.
The While Kentucky Was Sleeping report examines early state test data from the NAEP (Generally from 1992 except for Grade 8 Reading which didn’t get its first state level test until 1998) and the most recent, 2019 results.
Because state participation on NAEP was voluntary before 2003, and because sometimes NAEP’s samples of student subgroups don’t include enough students to confidently present scores with acceptable sampling errors, the number of states considered in each example varies.
But the message, summarized in the table below, is consistent. Among those states with full score data available for both years, Kentucky fails to rank in even one area in the “middle of the pack” in 2019. Even worse, in six of the eight cases examined, Kentucky has lost ground compared to other states since the 1990s.
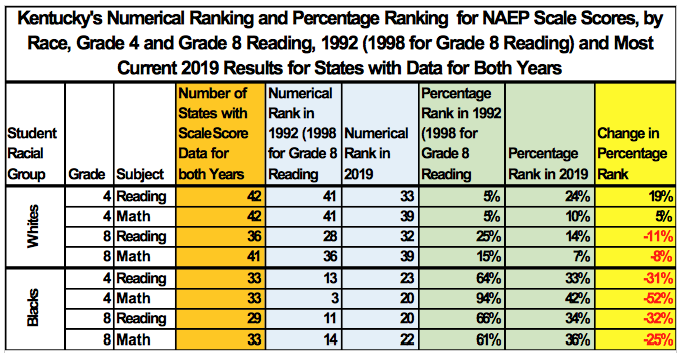
Here’s what the table shows:
Reading across the first row of data, which covers white students’ performance in Grade 4 NAEP reading, a total of 42 states had scores reported for both years (1992 and 2019). In 1992 Kentucky ranked very low at 41 out of the total of 42 states that participated. In 2019, that improved, a bit, to Kentucky ranking 33 out of the 42 states.
On a percentage basis, in 1992 Kentucky’s ranking was at the 5% level among all the states with scores reported for both years. By 2019, Kentucky moved up a bit to the 24% level. The change was 19 percentage points. This is the best performance change shown in the table. But, Kentucky’s NAEP Grade 4 Reading results for white students in 2019 clearly are not a middle of the pack performance.
In most cases, as you can see by the many negative figures in the “Change in Percentage Rank” column, Kentucky actually lost ground from where it was in the early days of the state’s education reform known as KERA.
By far, the most disappointing situation is for Kentucky’s Black students. They not only lost ground in every area listed, but they also moved from above, sometimes well above, the middle of the states in the 1990s to notably below the middle of the pack – in every area. The KERA era in Kentucky has not enabled the state’s largest minority population to even keep pace with their racial counterparts in other states.

By the way, I analyzed the scores separately by race because student racial demographics now vary dramatically by state. This is a practice NAEP encourages in the science report card mentioned earlier.
In NAEP Grade 4 Reading for 2019, for example, NAEP data shows Kentucky’s public school classrooms were still 75% white, while across the nation the public school classrooms were only 46% white. If you only look at overall average scores for each state, what you wind up doing is comparing a whole lot of white students in Kentucky to lots of students of color in other states. Thanks to the endemic achievement gaps, that would just make Kentucky’s performance look much better than it really is.
To get an accurate picture, you have to break things out with NAEP and look at student subgroup performances to get a more apples-to-apples set of comparisons.
To summarize, as of 2019, in no case among the eight comparisons discussed above does Kentucky rank at the middle for any subject/grade/racial group combination. For whites, who, don’t forget, make up 75% of the state’s public school classrooms, the math rankings are of major concern.
For Black students in the Bluegrass State, the KERA period has been a story of notable decline in every area compared to their racial counterparts in other states. Claiming anything else is especially harmful to Kentucky’s largest racial minority group.
An important lesson from this is people who claim notable progress for Kentucky’s education system are not well informed and just don’t know the truth. Worse, their actions tend to encourage less interest and a reduced sense of urgency in what was, and remains, a major education crisis for the Commonwealth.
For still more, check out our report, While Kentucky’s Education System Was Sleeping….
Richard G. Innes is staff education analyst for the Bluegrass Institute for Public Policy Solutions, Kentucky’s free-market think tank. He blogs frequently at www.bipps.org and can be reached at dinnes@freedomkentucky.com.